- Analýza
- Technická analýza
USD/JPY Technická analýza - USD/JPY Obchodování: 2025-04-10
USD/JPY Technical Analysis Summary
níže 146.443
Sell Stop
výše 147.613
Stop Loss
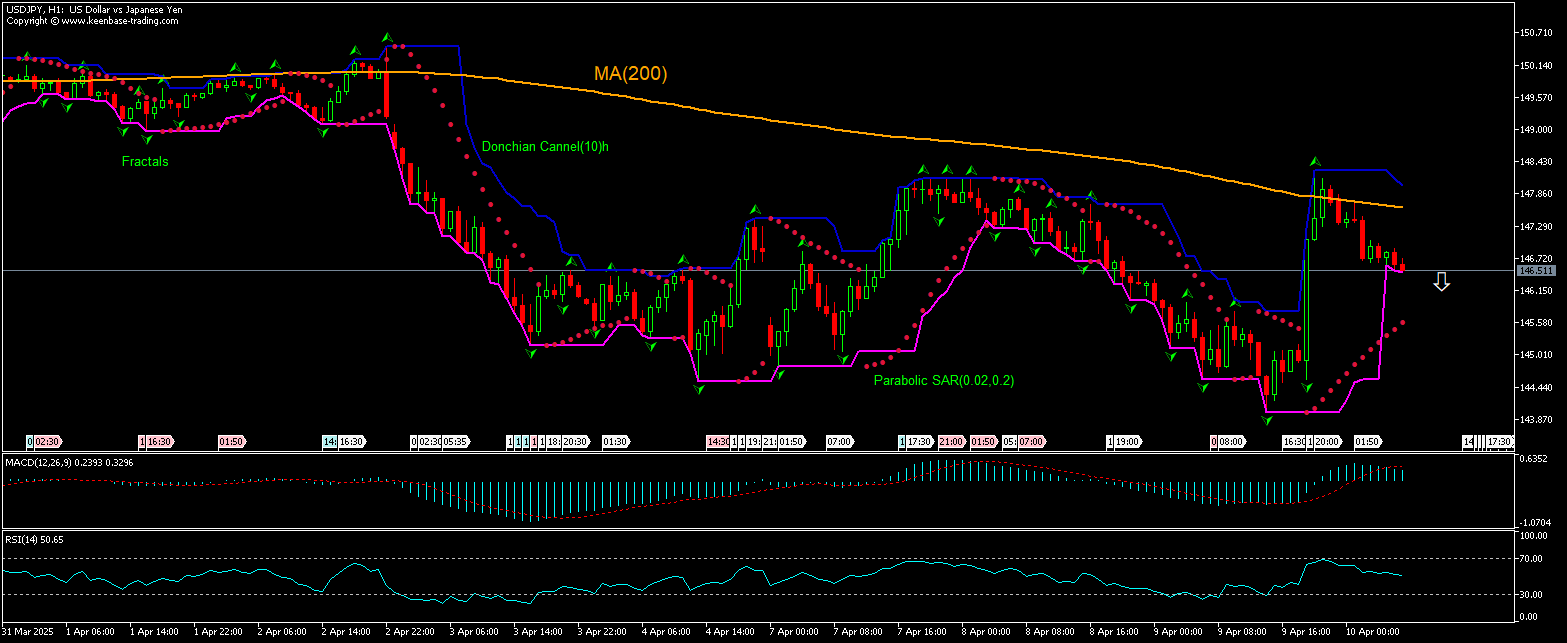
| Indicator | Signal |
| RSI | Neutrální |
| MACD | Sell |
| MA(200) | Sell |
| Fractals | Sell |
| Parabolic SAR | Buy |
| Donchian Channel | Sell |
USD/JPY Chart Analysis
USD/JPY Technická analýza
The technical analysis of the USDJPY price chart on 1-hour timeframe shows USDJPY,H1 is retreating after unsuccessful test of the 200-period moving average MA(200) yesterday. We believe the bearish movement will continue after the price breaches below the lower bound of the Donchian channel at 146.443. A level below this can be used as an entry point for placing a pending order to sell. The stop loss can be placed above 147.613. After placing the order, the stop loss is to be moved to the next fractal high , following Parabolic indicator signals. Thus, we are changing the expected profit/loss ratio to the breakeven point. If the price meets the stop loss level without reaching the order, we recommend cancelling the order: the market has undergone internal changes which were not taken into account.
Fundamentální analýza Forex - USD/JPY
Japan’s producer prices inflation accelerated in March. Will the USDJPY price decline?
Japan’s producer prices inflation accelerated in March: the Bank of Japan reported Japan's Producer Price Index (PPI) growth ticked up to 4.2% over year in March after 4.1% growth in February, when a decline to 3.9% rate was expected. It was the 49th straight month of producer inflation, with prices rising further for most components led by non-ferrous metals (12.3% vs 13.4%), and petroleum and coal (8.6% vs 5.9% and 4.7%). Producer prices grew by 0.4% over month, accelerating from 0.2% increase in February and marking the steepest rise in three months. Higher than expected Japan’s producer prices inflation is bullish for yen and bearish for USDJPY currency pair.
Poznámka:
Tento přehled má informativně poznávací charakter a publikuje se zdarma. Všechny údaje, uvedené v přehledu, jsou získány z otevřených zdrojů, jsou uznávány více méně spolehlivé. Přitom, neexistují žádné garance, že uvedená informace je úplná a přesná. Přehledy se v budoucnu neobnovují. Veškerá informace v každém přehledu, včetně názorů, ukazatelů, grafů, je pouze poskytována a není finančním poradenstvím nebo doporučením. Celý text nebo jeho jakákoliv část a také grafy nelze považovat za nabídku provádět nějaké transakce s jakýmikoliv aktivy. Společnost IFC Markets a její zaměstnanci za žádných okolností nemají žádnou odpovědnost za jakékoli kroky učiněné kýmkoliv po nebo v průběhu seznámení s přehledem.


