- Analýza
- Technická analýza
Index SP500 Technická analýza - Index SP500 Obchodování: 2025-04-16
Standard & Poor’s (500), Fondový index Technical Analysis Summary
níže 5304.37
Sell Stop
výše 5447.83
Stop Loss
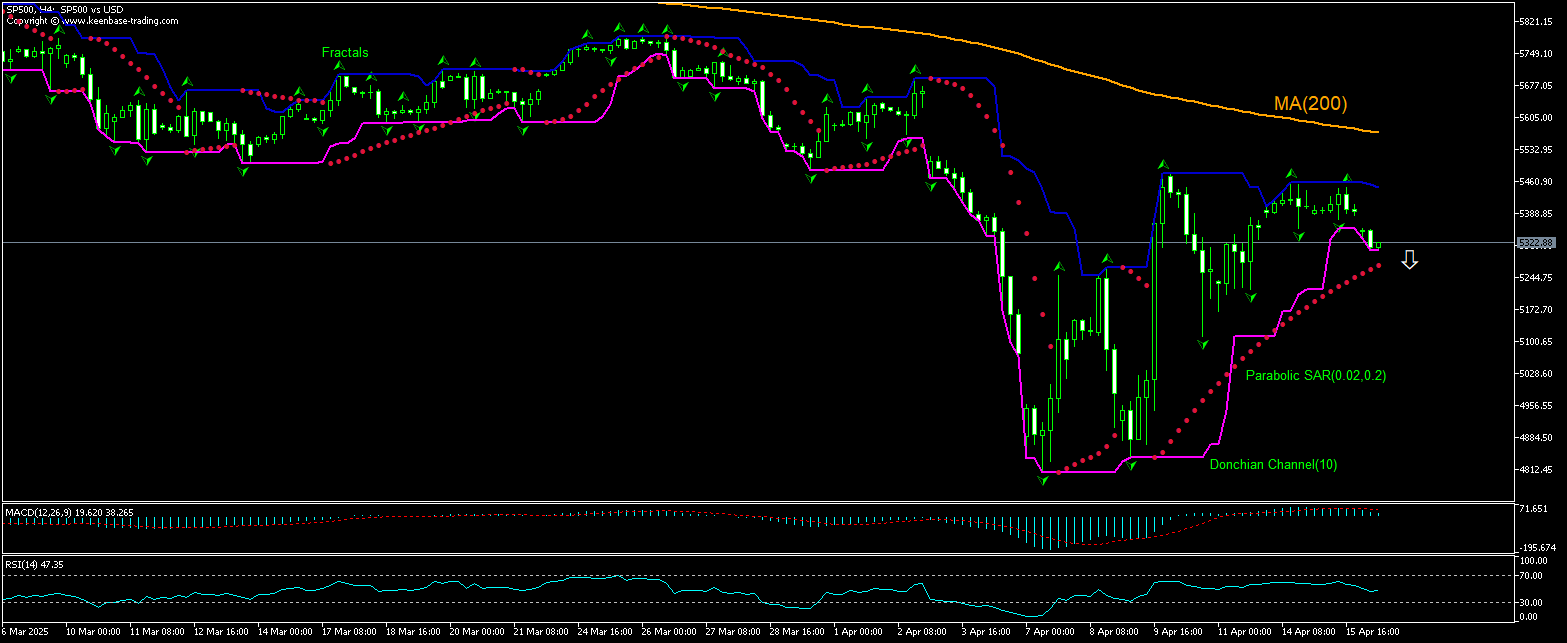
| Indicator | Signal |
| RSI | Neutrální |
| MACD | Sell |
| Donchian Channel | Sell |
| MA(200) | Sell |
| Fractals | Sell |
| Parabolic SAR | Buy |
Standard & Poor’s (500), Fondový index Chart Analysis
Standard & Poor’s (500), Fondový index Technická analýza
On SP500 technical analysis of the price chart in 4-hour timeframe reveals the SP500,H4 is retreating under the 200-period moving average MA(200) after rebounding to one-week high two days ago. We believe the bearish momentum will continue after the price breaches below the lower boundary of Donchian channel at 5304.37. A level below this can be used as an entry point for placing a pending order to sell. The stop loss can be placed above 5447.83. After placing the order, the stop loss is to be moved every day to the next fractal high, following Parabolic signals. Thus, we are changing the expected profit/loss ratio to the breakeven point. If the price meets the stop loss level (5447.83) without reaching the order (5304.37), we recommend cancelling the order: the market has undergone internal changes which were not taken into account
Fundamentální analýza Indexy - Standard & Poor’s (500), Fondový index
US economic reports were mixed yesterday. Will the SP500 decline continue?
Recent US economic data were mixed. The decline in New York State manufacturing activity slowed while US import prices decreased. According to the Empire State Manufacturing Survey, the Empire State Manufacturing Index rose to -8.1 in April from -20.0 in March when an increase to -12.8 was expected. Readings above 0.0 indicate improving conditions, below 0.0 indicate worsening conditions. The Federal Reserve Bank of New York reported that the business activity declined modestly after steep decline in previous month, while “price increases picked up to the fastest pace in more than two years. Firms turned pessimistic about the outlook for the first time since 2022.” At the same time, the Bureau of Labor Statistics reported US import prices unexpectedly fell while export prices remained unchained. Import prices slipped 0.1% over month in March on lower fuel costs following a downwardly revised 0.2% increase in February when no change was expected. In annual terms, import prices increase slowed to 0.9% over year in March from a 1.6% rise in February. Slower than expected decline in New York State manufacturing activity is bullish for SP500, while declining import prices is bearish for the SP500 index. The current setup is bearish for the SP500.
Poznámka:
Tento přehled má informativně poznávací charakter a publikuje se zdarma. Všechny údaje, uvedené v přehledu, jsou získány z otevřených zdrojů, jsou uznávány více méně spolehlivé. Přitom, neexistují žádné garance, že uvedená informace je úplná a přesná. Přehledy se v budoucnu neobnovují. Veškerá informace v každém přehledu, včetně názorů, ukazatelů, grafů, je pouze poskytována a není finančním poradenstvím nebo doporučením. Celý text nebo jeho jakákoliv část a také grafy nelze považovat za nabídku provádět nějaké transakce s jakýmikoliv aktivy. Společnost IFC Markets a její zaměstnanci za žádných okolností nemají žádnou odpovědnost za jakékoli kroky učiněné kýmkoliv po nebo v průběhu seznámení s přehledem.


